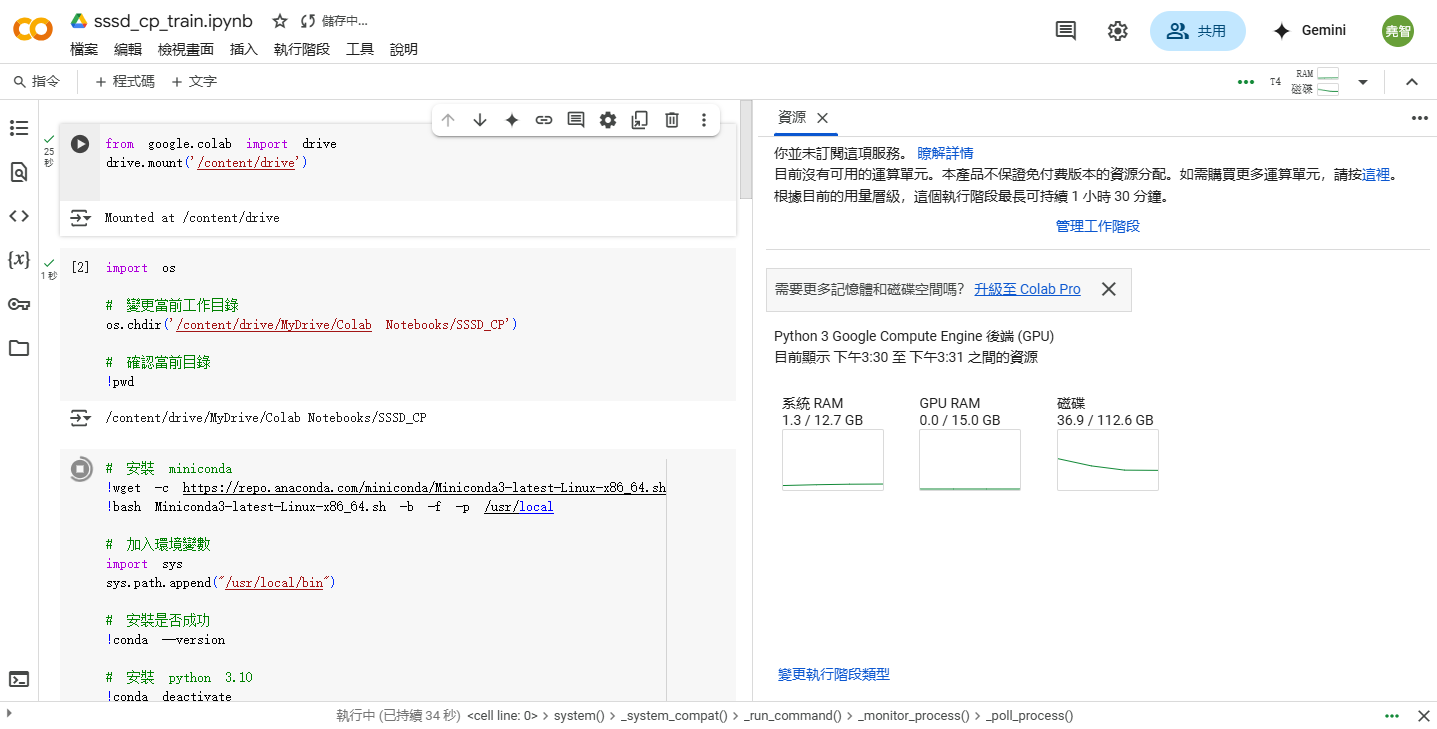
前言 如1140318 meeting 使用 Google Colab 所進行的訓練。以下使用 training.yaml 中所設定的 output_directory 輸出的 checkpoint 進行填補預測。使用 Google Colab 訓練的過程。
進行填補 本次使用的 checkpoint 是 40.pkl ,而用於填補的設定檔案 inference.yaml 如下:
 1
 2
 3
 4
 5
 6
 7
 8
 9
10
11
12
13
14
15
# Inference configuration
batch_size : 80 # Batch size for inference
output_directory : "./results/checkpoint" # Output directory for inference results
ckpt_path : "./results/checkpoint" # Path to checkpoint for inference
trials : 1 # Replications
# Additional training settings
only_generate_missing : true # Generate missing values only
use_model : 2 # Model to use for training
masking : "forecast" # Masking strategy for missing values
missing_k : 24 # Number of missing values
# Data paths
data :
test_path : "./datasets/Mujoco/test_mujoco.npy" # Path to test data
接下來於目錄 /content/drive/MyDrive/Colab Notebooks/SSSD_CP 執行以下指令即可。
1
./scripts/diffusion/training_job.sh -m configs/model.yaml -t configs/training.yaml
填補過程如下:
 1
 2
 3
 4
 5
 6
 7
 8
 9
10
11
12
13
14
15
( sssd) user@LAPTOP-KOPTLCHM:/mnt/d/Code/sssd_cp_learning_and_testing/learning_and_testing/SSSD_CP$ ./scripts/diffusion/inference_job.sh -m configs/model.yaml -i configs/inference.yaml
Intializing conda
Activating Conda Env: sssd
[ Execution - Inference]
/mnt/d/Code/sssd_cp_learning_and_testing/learning_and_testing/SSSD_CP/scripts/diffusion/infer.py --model_config configs/model.yaml --inference_config configs/inference.yaml
2025-03-28 23:37:22,508 - sssd.utils.logger - INFO - Using 1 GPUs!
2025-03-28 23:37:22,747 - sssd.utils.logger - INFO - Current time: 2025-03-28 23:37:22
2025-03-28 23:37:35,139 - sssd.utils.logger - INFO - The 1th inference trial
2025-03-28 23:37:35,147 - sssd.utils.logger - INFO - Output directory: ./results/checkpoint/T200_beta00.0001_betaT0.02/max
2025-03-28 23:37:39,913 - sssd.utils.logger - INFO - Successfully loaded model at iteration 40
2025-03-29 00:09:03,790 - sssd.utils.logger - INFO - Average MSE: 0.010974319986999034
2025-03-29 00:09:03,792 - sssd.utils.logger - INFO - Average MAPE: 0.08939487636089324
2025-03-29 00:09:03,792 - sssd.utils.logger - INFO - Current time: 2025-03-29 00:09:03
Inference Job completed
( sssd) user@LAPTOP-KOPTLCHM:/mnt/d/Code/sssd_cp_learning_and_testing/learning_and_testing/SSSD_CP$
填補結果 原程式碼預設採用 60,000 iteration ,並每 1,000 iterations 儲存一個 checkpoint 。此處修改成每 10 iterations 儲存一個 checkpoint ,以便在 Colab 中使用。
在後續的整理中,由於僅使用 40 iteration 的 checkpoint ,故在預測方面似乎不太穩定。以下使用無 NA 的 test_mujoco 資料進行填補預測。
 1
 2
 3
 4
 5
 6
 7
 8
 9
10
11
def check_dataset ( file_path ):
data = np . load ( file_path , allow_pickle = True )
print ( f 'Type: { type ( data ) } , Shape: { data . shape } ' )
print ( f ' { data } \n ' )
return data
print ( f 'imputation0.npy' )
file_path = os . path . join ( output_dir_path , 'imputation0.npy' )
imputation0 = check_dataset ( file_path )
imputation0 . shape
np . isnan ( imputation0 ) . sum ()
 1
 2
 3
 4
 5
 6
 7
 8
 9
10
11
12
13
14
15
16
17
18
19
20
21
22
23
24
25
26
27
28
29
30
31
32
33
34
35
36
37
38
39
40
41
42
43
44
45
46
47
48
49
50
51
52
53
54
55
56
57
58
59
60
61
62
63
64
65
66
67
68
69
70
71
72
73
74
75
76
77
78
79
80
81
82
83
84
85
86
87
88
89
imputation0.npy
Type: <class 'numpy.ndarray' >, Shape: ( 80, 14, 100)
[[[ 0.8157633 0.8156557 0.8146281 ... 0.75298077 0.7537323
0.75174457]
[ 0.06514366 0.05776227 0.05183683 ... 0.04678385 0.0501639
0.0363501 ]
[ 0.78880674 0.7846591 0.7800709 ... 0.7705696 0.778813
0.76613754]
...
[ 1.96113 1.9714217 1.9793615 ... 1.8286759 1.844383
1.8519415 ]
[ 0.6622794 0.6593748 0.65476274 ... 0.7362109 0.7321954
0.7286315 ]
[ 1.4597307 1.4632452 1.4633918 ... 1.3551543 1.357508
1.3558007 ]]
[[ 1.1138667 1.1208674 1.1270115 ... 1.3856113 1.3797332
1.4006671 ]
[ 0.57433873 0.5769979 0.5795037 ... 0.7060426 0.69445616
0.6761989 ]
[ 0.7469381 0.73818797 0.729336 ... 0.44045123 0.4424169
0.45701537]
...
[ 2.0799923 2.0878828 2.094913 ... 1.814113 1.8128045
1.8442494 ]
[ 0.8129976 0.8022864 0.7910281 ... 0.77923393 0.7828551
0.7763896 ]
[ 1.4558572 1.458524 1.4599439 ... 1.3523364 1.3496785
1.3411465 ]]
[[ 0.70482075 0.7031074 0.700182 ... 0.39332697 0.3953202
0.40215322]
[ 0.7516237 0.75217587 0.75191456 ... 0.31852198 0.3148801
0.2996708 ]
[ 0.71148103 0.7108106 0.7099728 ... 0.5982876 0.6058803
0.58975494]
...
[ 2.0782096 2.0815523 2.0821166 ... 1.8980634 1.888002
1.8895404 ]
[ 0.6816353 0.68313247 0.6829587 ... 0.713336 0.71706104
0.72934574]
[ 1.4548547 1.4566466 1.4566258 ... 1.3703356 1.3688762
1.3600807 ]]
...
[[ 1.1598428 1.1644095 1.1672181 ... 1.1946396 1.1942233
1.1921071 ]
[ 0.18472806 0.17742933 0.17142007 ... 0.01138662 0.00748964
-0.0080883 ]
[ 1.1556199 1.1594166 1.1622467 ... 1.3111589 1.3095644
1.2983494 ]
...
[ 2.1374972 2.141306 2.1465597 ... 1.9499655 1.9456829
1.9349406 ]
[ 0.71059424 0.71178204 0.71273285 ... 0.7393154 0.7427006
0.73711395]
[ 1.3767997 1.3675404 1.3634468 ... 1.4109248 1.4163282
1.4174494 ]]
[[ 1.2437149 1.2480913 1.2517792 ... 1.4891158 1.4795951
1.4826915 ]
[ 0.646242 0.6451723 0.64391106 ... 0.12042134 0.10997444
0.10008696]
[ 0.9727835 0.97207093 0.97110224 ... 0.83852965 0.83061826
0.81636393]
...
[ 2.1377456 2.138864 2.139544 ... 1.7650563 1.7563668
1.7796011 ]
[ 0.6908849 0.69107974 0.69092757 ... 0.8569067 0.8522854
0.83625597]
[ 1.4663079 1.4668671 1.4668332 ... 1.3557321 1.3657166
1.3668913 ]]
[[ 0.8577512 0.8552606 0.85153466 ... 0.59119904 0.58812493
0.61288357]
[ 0.3297042 0.3267195 0.32366514 ... 0.06684028 0.06520659
0.04435476]
[ 1.1415007 1.1442469 1.1458464 ... 1.0757027 1.0744487
1.0696038 ]
...
[ 1.6184572 1.6150465 1.6144245 ... 1.9198064 1.9197948
1.9036767 ]
[ 0.7942188 0.7945403 0.7933444 ... 0.6909663 0.69044065
0.70743614]
[ 1.1912296 1.3175381 1.3868362 ... 1.3639514 1.3598384
1.356443 ]]]
( 80, 14, 100)
np.int64( 0)
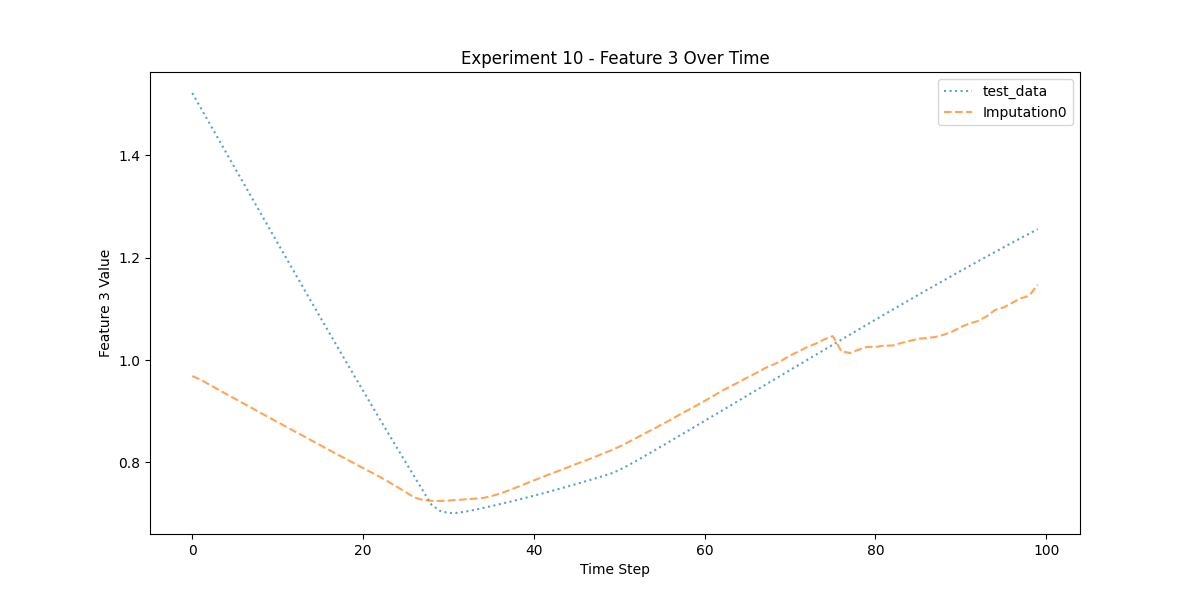
以下檢視 imputation0 中的第 10 次實驗第 3 個特徵。
 1
 2
 3
 4
 5
 6
 7
 8
 9
10
11
12
13
14
15
16
17
18
19
20
21
22
23
24
25
26
27
28
29
30
31
32
33
34
35
def plot_experiment_feature ( test_data , imputation0 , n , f ):
"""
繪製第 n 次實驗的第 f 個特徵值隨時間變化,包含 test_data 和 imputation0。
:param test_data: (500, 14, 100) 的數據集,需要轉置為 (500, 100, 14)
:param imputation0: (500, 14, 100) 的數據集,需要轉置為 (500, 100, 14)
:param n: 指定實驗次數
:param f: 指定特徵索引
"""
# 轉置 test_data 和 imputation0,使形狀變為 (500, 100, 14)
imputation0 = imputation0 . transpose ( 0 , 2 , 1 )
if min ( test_data . shape [ 1 ], imputation0 . shape [ 1 ]) < n :
n = min ( test_data . shape [ 1 ], imputation0 . shape [ 1 ])
if min ( test_data . shape [ 2 ], imputation0 . shape [ 2 ]) < f :
f = min ( test_data . shape [ 2 ], imputation0 . shape [ 2 ])
time_steps = np . arange ( test_data . shape [ 1 ])
plt . figure ( figsize = ( 12 , 6 ))
plt . plot ( time_steps , test_data [ n , :, f ], label = "test_data" , alpha = 0.7 , linestyle = 'dotted' )
plt . plot ( time_steps , imputation0 [ n , :, f ], label = "Imputation0" , alpha = 0.7 , linestyle = 'dashed' )
plt . xlabel ( "Time Step" )
plt . ylabel ( f "Feature { f } Value" )
plt . title ( f "Experiment { n } - Feature { f } Over Time" )
plt . legend ()
plt . show ()
## plot
n = 10 # 第 10 次實驗
f = 3 # 第 3 個特徵
plot_experiment_feature ( test_mujoco , imputation0 , n , f )
第 10 次實驗第 3 個特徵的填補結果。
計算整體 MSE 如下
 1
 2
 3
 4
 5
 6
 7
 8
 9
10
11
12
13
14
15
# 讀取並合併 imputation0.npy ~ imputation24.npy
imputation_list = []
for i in range ( 25 ):
imputation_path = os . path . join ( output_dir_path , f 'imputation { i } .npy' )
imputation_list . append ( check_dataset ( imputation_path ))
# 合併成一個 numpy 陣列
imputation = np . concatenate ( imputation_list , axis = 0 )
imputation . shape
# 畫圖
#for n in range(2000):
# plot_experiment_feature(test_mujoco, imputation, n, f)
print ( f 'MSE: { np . mean (( test_mujoco - imputation . transpose ( 0 , 2 , 1 )) ** 2 ) } ' )
1
MSE: 0.10970357060432434
運行環境 平臺:Google Colaboratory Miniconda GPU:Python 3 Google Compute Engine 後端 (GPU) Tesla T4 CUDA 12.4 driver 程式語言:Python 3.10.16 for Linux 延伸學習 參考資料