目錄

k-平均聚類分析

封面圖片由 ChatGPT 生成。

前言

k-平均聚類分析(k-means clustering),在中文地區常被稱為 k-平均演算法,簡稱 k-means。這是一種將 $n$ 個資料點分成 $k$ 個群集(clusters)的分群方法,使得每一個點都能歸屬於距離它最近的群集中心(centroid)。

在機器學習的分類中,k-means 屬於非監督式學習(unsupervised learning),因為它在訓練過程中不需要任何資料標籤(label),僅透過計算資料點之間的距離來進行分群。這種方式有點類似人類社會中人們自然形成的小團體:沒有預先的分類規則,僅根據彼此的相似程度自動聚在一起。

K-means 原理

假設有一個資料集 $$ x_1, x_2, \cdots, x_n $$

其中,每一個資料值 $x_i \in \mathbb{R}^d$ , $i = 1, 2, \cdots, n$。為了將 $n$ 個資料點分配到鄰近的 $k$ 個群集,我們需要知道對於單一點 $x_i$ 來說, $x_i$ 距離哪一個群集中心最近,以將 $x_i$ 分配到該群集。

在此之前,我們得先決定群集中心的初始值。隨機給定 $k$ 個點作為群集中心,接下來就可以計算點 $x_i$ 距離哪一個中心點最近,而將該點歸類到某一群中。至於計算距離的方法,可以使用各種不同的距離度量方法,例如歐式距離

待每一個點都計算並分類到最近的群集中心後,由各群集重新計算新的群集中心,群中心的算法為計算該群各維度的平均值所得到的那一個點坐標。接下來,重複將點重新分配到群集、找群集中心這些步驟。

最後,當新找出的群集中心不再變化,或是中心點的變化已經小到可以忽略不計時,就完成 k-means 的運算了,而找到群集中心這個步驟,可以看作是將 $n$ 個點分配到 $k$ 個集合中,使得每個集合內的平方和(within-cluster sum of squares, WCSS)最小,可以以下列公式表示:

$$ \argmin_\mathbf{S} \sum_{j=1}^k \sum_{x \in S_j} \| x - \mu_j \|^2, $$

其中, $\mathbf{S}$ 為包含所有點的集合, $\mathbf{S} = \{S_1, S_2, \cdots, S_k\}$ , $S_j$ 為各群集, $j = 1, 2, \cdots, k$ , $\mu_j$ 為群集 $S_j$ 的中心, $x$ 為群集 $S_j$ 中的所有點,且各群集內所擁有的點數量不一定一樣多,也就是 $|S_j| \neq |S_m|$ 。

演算法

簡單來說, k-means 演算法的公式如下:

  1. 隨機設定 $k$ 個點作為群集中心。
  2. 計算每一個點到各群集中心的距離。
  3. 將各點分配到最近的群集中心。
  4. 計算分配到群集的資料點的各維度平均值,找出新的群集中心。
  5. 比較新的群集中心與原本的群集中心是否有所差異,如果差異不大就停止演算法,否則回到步驟 2 。

Python 範例

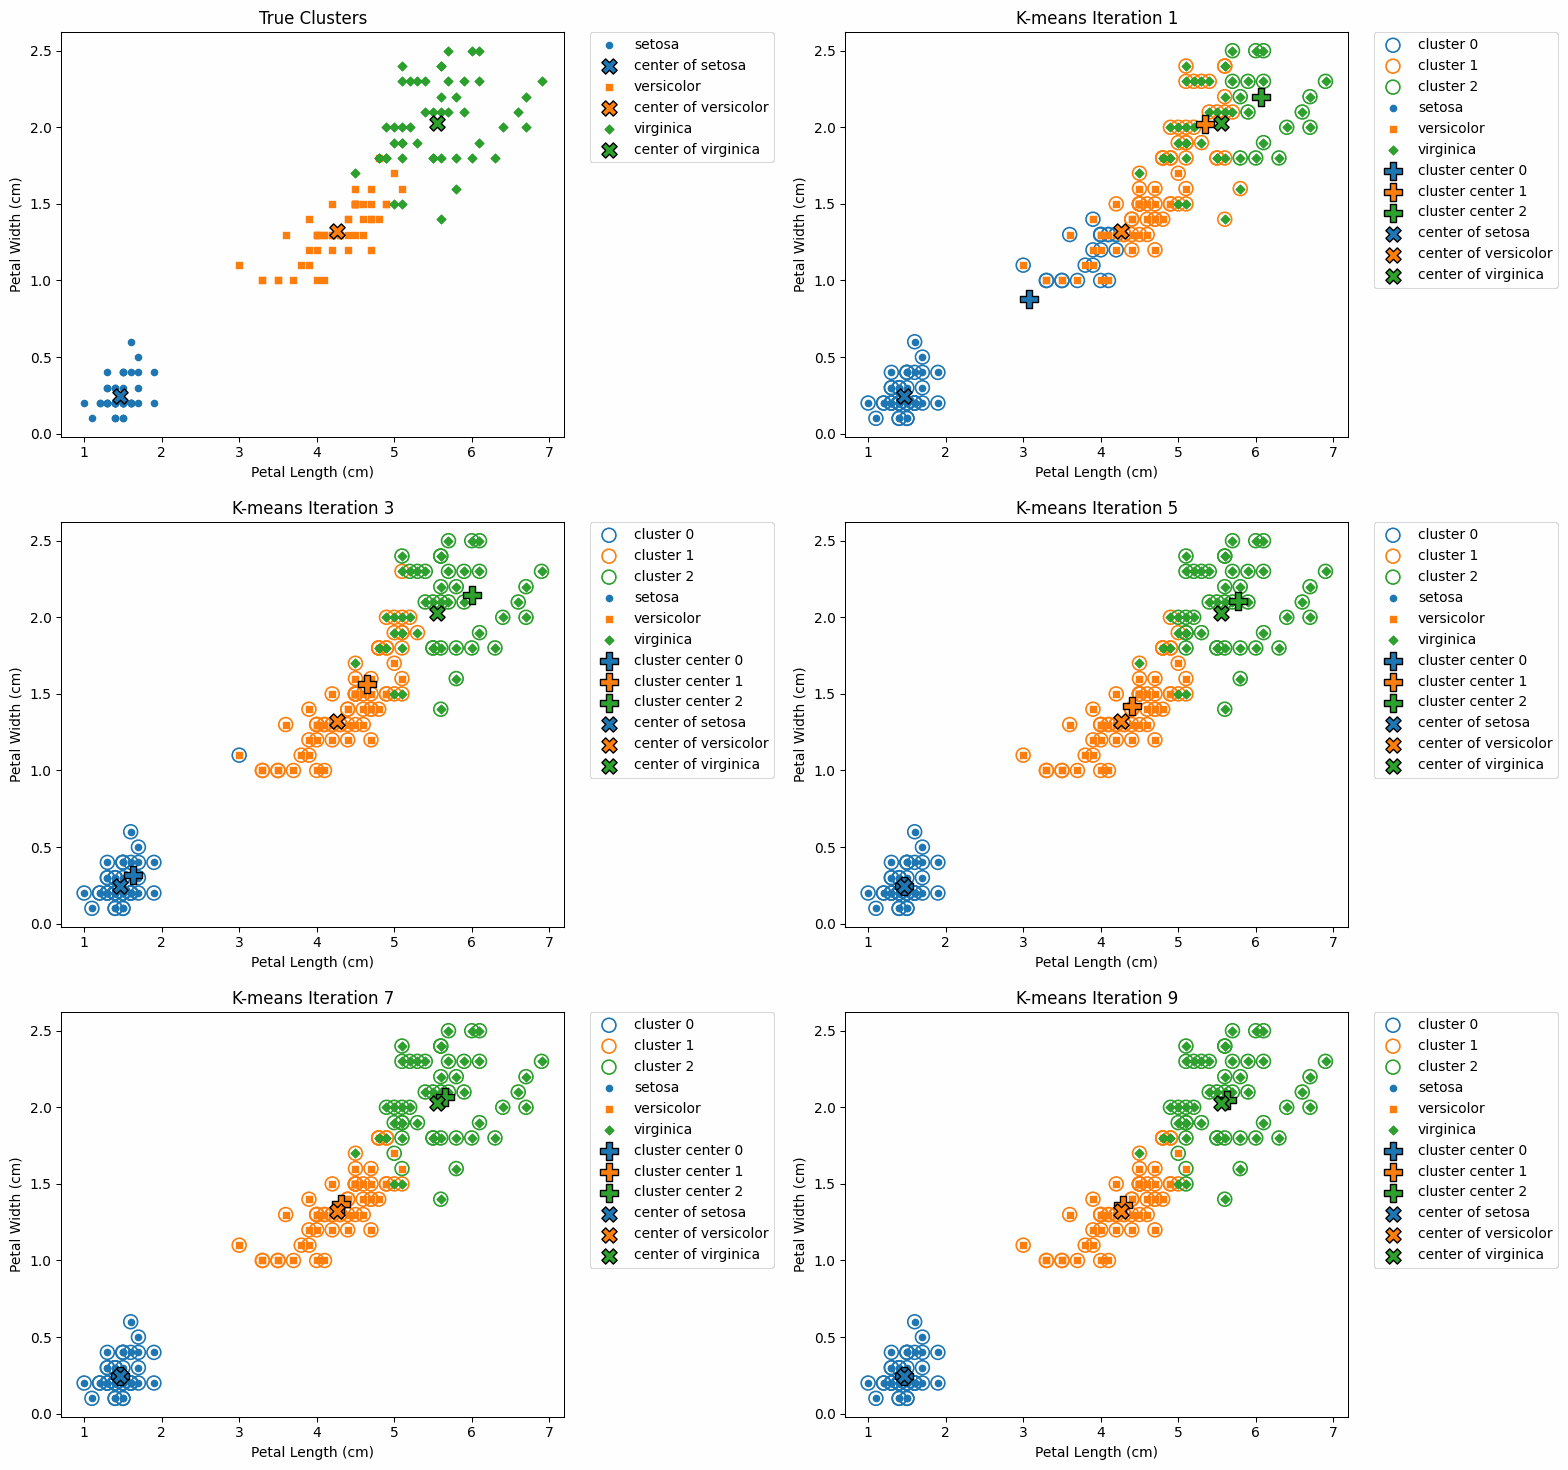
https://raw.githubusercontent.com/Josh-test-lab/kmeans-example/refs/heads/main/kmeans_iris_iter/kmeans_iterations.gif
K-means 範例。

資料集說明

以下將使用 Iris 資料集作為範例, Iris 資料集是一個經典的機器學習與統計分析資料集,常被用於分類與視覺化的練習,其目標為預測鳶尾花(iris flower)的品種。

在此資料集中,包含:

  • 樣本數:150 筆。
  • 特徵數:4 個數值型特徵。
    • 花萼長度(sepal length,單位:公分)
    • 花萼寬度(sepal width,單位:公分)
    • 花瓣長度(petal length,單位:公分)
    • 花瓣寬度(petal width,單位:公分)
  • 類別數:3 種花的品種。
    • 山鳶尾(setosa)
    • 變色鳶尾(versicolor)
    • 維吉尼亞鳶尾(virginica)

前置準備

在 Python 中,我們可以從 sklearn 模組讀取 Iris 資料集。在以下範例中,我們使用後兩個特徵值,也就是花瓣長度與花瓣寬度作為視覺化的分類項目。

 1
 2
 3
 4
 5
 6
 7
 8
 9
10
11
12
13
14
15
# import modules
import numpy as np
import matplotlib.pyplot as plt
import os
from sklearn.datasets import load_iris
from sklearn.metrics import pairwise_distances_argmin

# Iris data
iris = load_iris()  # load data
X = iris.data[:, 2:]  # data
y_true = iris.target  # target
class_names = iris.target_names  # Iris class names

print(f'\nclass names: \n{class_names}')
print(f'\nfeature names: \n{iris.feature_names}')
執行結果參考
1
2
3
4
5
class names: 
['setosa' 'versicolor' 'virginica']

feature names: 
['sepal length (cm)', 'sepal width (cm)', 'petal length (cm)', 'petal width (cm)']

以下設定需要的分類數量。由於我們已知鳶尾花共有 3 種,因此這裡直接將真值數量 true_clusters 由資料集形狀讀取,並設定需要分群的數量 n_clusters 為 3 。如想要試試分成更多群集,也可以調整 n_clusters

1
2
3
4
5
6
# configs
true_clusters = iris.target_names.shape[0]  # true clusters
n_clusters = 3  # number of clusters we want to classify

output_dir = 'kmeans_iris_iter'  # output directory
os.makedirs(output_dir, exist_ok=True)

以下設定真值得群集中心,方便後續比較 k-means 的分群效果。同時,設定不同顏色,方便後續視覺化比較。

 1
 2
 3
 4
 5
 6
 7
 8
 9
10
11
# true centers
true_centers = np.array([X[y_true == i].mean(axis=0) for i in range(true_clusters)])

print(true_centers)

# colors
cmap = plt.get_cmap('tab10')
colors = [cmap(i) for i in range(max(true_clusters, n_clusters))]

# markers
markers = ['o', 's', 'D']
執行結果參考
1
2
3
4
5
6
# colors
cmap = plt.get_cmap('tab10')
colors = [cmap(i) for i in range(max(true_clusters, n_clusters))]

# markers
markers = ['o', 's', 'D']

真值散佈圖

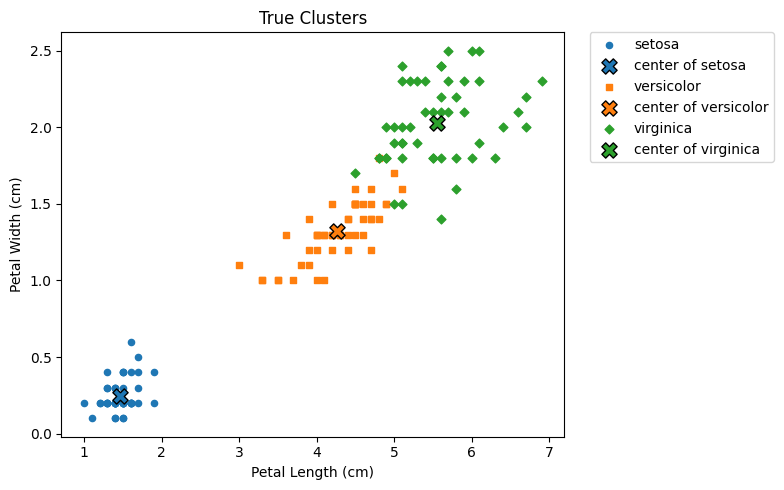
做好前置準備後,現在繪製實際的鳶尾花分類情形,如下:

 1
 2
 3
 4
 5
 6
 7
 8
 9
10
11
12
13
14
15
16
# plot of true values
plt.figure(figsize=(8, 5))
for i in range(true_clusters):
    # true values
    plt.scatter(X[y_true == i, 0], X[y_true == i, 1], color=colors[i], marker=markers[i], s=20, label=f'{class_names[i]}')
    # true centers
    plt.scatter(true_centers[i, 0], true_centers[i, 1], color=colors[i], marker='X', edgecolor='black', s=120, label=f'center of {class_names[i]}')

plt.title(f'True Clusters')
plt.xlabel('Petal Length (cm)')
plt.ylabel('Petal Width (cm)')
plt.legend(loc='upper left', bbox_to_anchor=(1.05, 1.0), borderaxespad=0)
plt.tight_layout()
plt.savefig(f'{output_dir}/true.png', bbox_inches='tight')
plt.show()
plt.close()

https://raw.githubusercontent.com/Josh-test-lab/kmeans-example/refs/heads/main/kmeans_iris_iter/true.png
鳶尾花使用花瓣特徵值分類的真實值。

如上圖,藍色表示山鳶尾,橘色表示變色鳶尾,綠色表示維吉尼亞鳶尾;而 ✕ 表示各群集中心。

K-means

首先,初始化群集中心。這裡固定種子為 123 ,並隨機選取 n_clusters 個值作為分類的群集中心。

1
2
3
4
# initialize k-means center points
np.random.seed(123)  # set random seed
init_idx = np.random.choice(len(X), size=n_clusters, replace=False)
centers = X[init_idx]

接下來,就可以進行迭代訓練並找出群集中心。以下將在迭代的同時,繪製各迭代的圖片,方便觀察群集中心的移動,並且也將真值繪製於圖上。

 1
 2
 3
 4
 5
 6
 7
 8
 9
10
11
12
13
14
15
16
17
18
19
20
21
22
23
24
25
26
27
28
29
30
31
32
33
34
35
36
37
38
39
40
41
42
# k-means
iteration = 0
while True:
    # assign each point to the nearest center
    labels = pairwise_distances_argmin(X, centers)

    plt.figure(figsize=(8, 5))
    # cluster values
    for i in range(n_clusters):
        plt.scatter(X[labels == i, 0], X[labels == i, 1], facecolors='none', edgecolors=colors[i], linewidths=1.2, s=100, label=f'cluster {i}')

    # true values
    for i in range(true_clusters):
        plt.scatter(X[y_true == i, 0], X[y_true == i, 1], color=colors[i], marker=markers[i], s=20, label=f'{class_names[i]}')
    
    # cluster centers
    for i in range(n_clusters):
        plt.scatter(centers[i, 0], centers[i, 1], color=colors[i], marker='P', edgecolor='black', s=180, label=f'cluster center {i}')

    # true centers
    for i in range(true_clusters):
        plt.scatter(true_centers[i, 0], true_centers[i, 1], color=colors[i], marker='X', edgecolor='black', s=120, label=f'center of {class_names[i]}')

    plt.title(f'K-means Iteration {iteration}')
    plt.xlabel('Petal Length (cm)')
    plt.ylabel('Petal Width (cm)')
    plt.legend(loc='upper left', bbox_to_anchor=(1.05, 1.0), borderaxespad=0)
    plt.tight_layout()
    plt.savefig(f'{output_dir}/kmeans_iter_{iteration:02d}.png', bbox_inches='tight')
    plt.show()
    plt.close()

    # update cluster centers
    new_centers = np.array([X[labels == i].mean(axis=0) if np.any(labels == i) else centers[i] for i in range(n_clusters)])

    # stop condition
    if np.sum((new_centers - centers)**2) < 1e-20:
        break
    
    # next iteration
    centers = new_centers
    iteration += 1

最後,整個迭代過程如下顯示:

gallery_made_with_nanogallery2-kmeans

在上圖中,實心點表示各鳶尾花種的實際分類,而空心圓圈 ◯ 則表示分類的群集; ✕ 表示各花種的真實中心,而 ✛ 則表示各分類群集的中心。

我們可以發現,在每次的迭代過程中,分類所得的群集中心 ✛ 逐漸接近真實中心 ✕。雖然在邊界區域仍出現少數分類錯誤的情況,但整體而言,k-means 在大多數區域已能正確地將資料點分配至對應的群集。

結語

k-means 演算法是一種簡單且高效的分群方法,廣泛應用於圖像處理、市場區隔、生物資訊等多種領域。透過反覆地更新群集中心與重新分配資料點,k-means 能夠在不需要標籤資料的情況下,自動找出潛在的結構與模式。

雖然 k-means 在許多情況下表現良好,但它也存在一些限制,例如對初始中心點敏感、只能處理凸型群集,以及對離群值較為脆弱等。因此,在實際應用中,我們需根據資料特性謹慎選擇演算法,或考慮與其他方法搭配使用,以獲得更穩定與準確的分群結果。

運行環境

  • 作業系統:Windows 11 24H2
  • 程式語言:Python 3.12.9

延伸學習

參考資料