多維尺度分析(MDS)

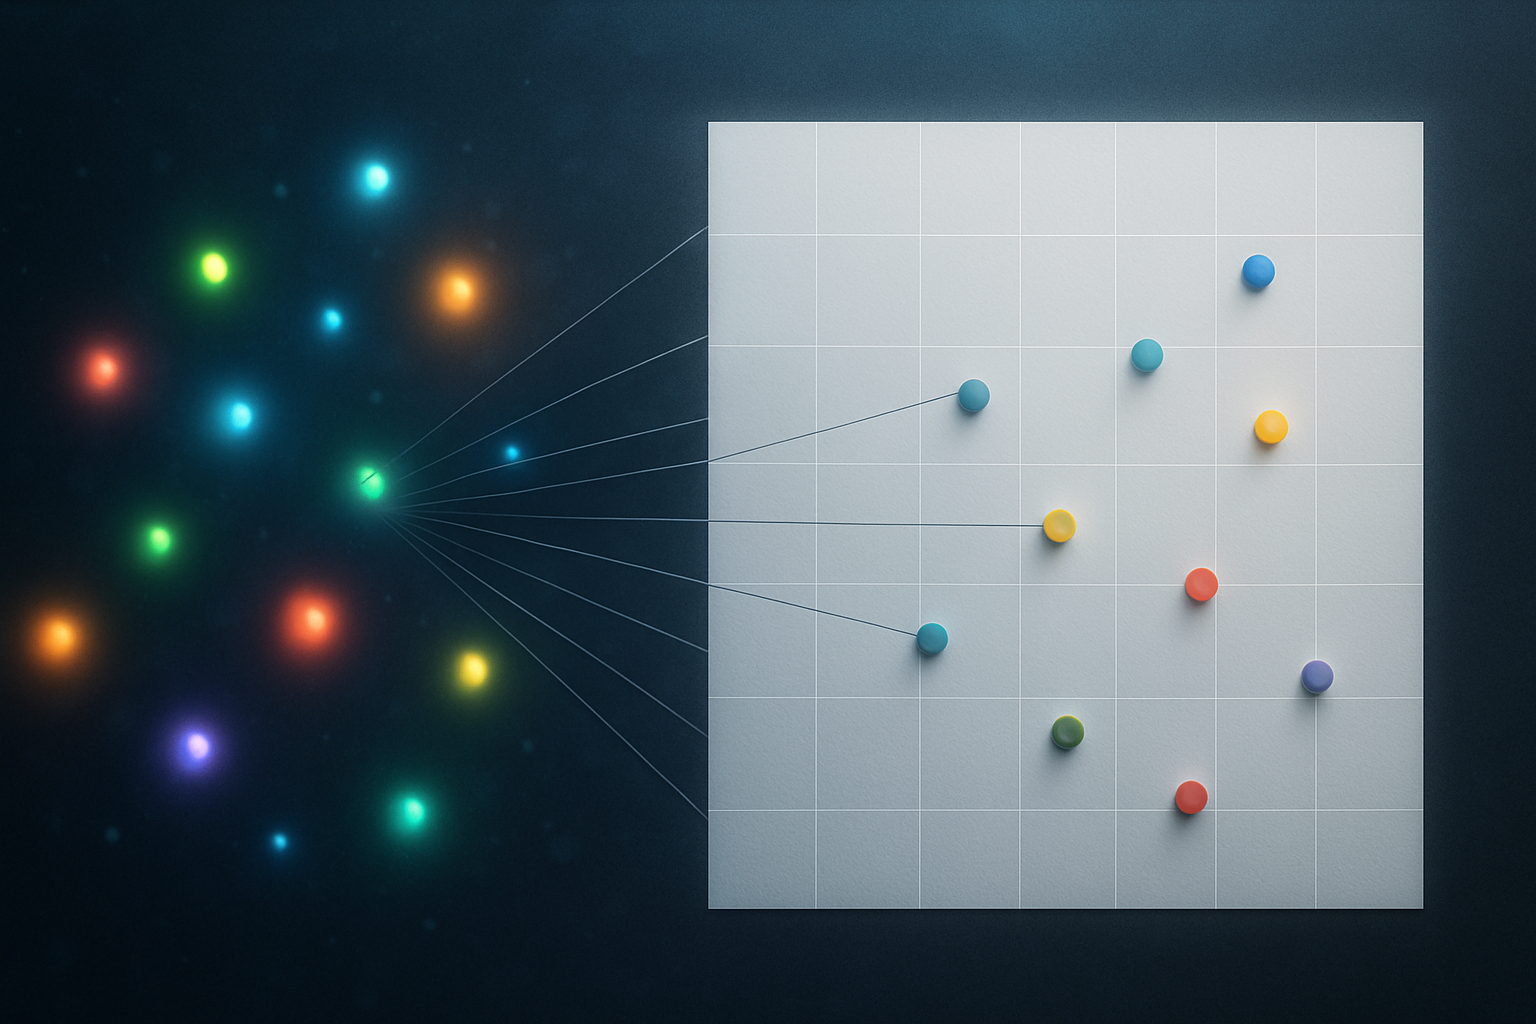
封面圖片為 ChatGPT 生成的多維尺度分析圖片,提示詞為 “A digital visualization illustrates multidimensional scaling (MDS): On the left side, a glowing cluster of colorful points is arranged in 3D space with a dark starry background, symbolizing high-dimensional data. On the right side, a clean white 2D grid contains the same points projected into 2D space. Thin lines connect each 3D point to its corresponding 2D location, showing dimensionality reduction. Futuristic, scientific style, 16:9 aspect ratio.” 。
前言
多維尺度分析(Multi-dimensional Scaling, MDS)是一種降維方法,透過計算資料集中物件兩兩之間的距離,並呈現在低維空間中,同時保留原資料的相對距離結構。 MDS 可視為一種將資料視覺化的方法,以便直觀地觀察資料的相對關係。
MDS 原理
MDS 是將資料集 $\mathbf{X}$ 中的樣本,透過不同的距離函數,如歐幾里得距離,轉換為距離矩陣(distance matrix) $\mathbf{D}$ 。而後,再經由距離還原為內積矩陣 $\mathbf{B}$ ,並進行特徵值分解,只保留前 $r$ 個正特徵值與特徵向量,即可獲取第 $i$ 個樣本在低維度的 $r$ 維空間中的向量 $x_i$ 。
以下詳細介紹經典的 MDS 實作方式。
假設現有資料集
$$ \mathbf{X} = (x_1, x_2, \cdots, x_n), $$
其中, $x_i = (x_{i1}, x_{i2}, \cdots, x_{ip})^\top$, $i = 1, 2, \cdots, n$ , $\mathbf{X}$ 為 $n \times p$ 矩陣。此處 $x_{ik}$ 表示第 $i$ 筆樣本在第 $k$ 個變數上的觀測值, $k = 1, 2, \cdots, p$ 。
距離矩陣
首先,計算資料集中各樣本的距離關係,常用的距離公式有
歐幾里得距離(Euclidean Distance)
$$ \begin{align*} d_{ij} = \|x_i - x_j\| & = \sqrt{(x_{i1} - x_{j1})^2 + (x_{i2} - x_{j2})^2 + \cdots + (x_{ip} - x_{jp})^2} \\ & = \sqrt{ \sum_{k=1}^{p} (x_{ik} - x_{jk})^2 }, \end{align*} $$
其中 $i, j = 1, 2, \cdots, n$,表示第 $i$ 筆樣本與第 $j$ 筆樣本間的距離。
歐幾里得距離是最常用的度量方式。
曼哈頓距離(Manhattan Distance)
$$ d_{ij} = \sum_{k=1}^{p} |x_{ik} - x_{jk}|. $$
曼哈頓距離也稱為城市街區距離(City Block Distance)。
餘弦距離(Cosine Distance)
$$ d_{ij} = 1 - \frac{ \sum_{k=1}^p x_{ik} x_{jk} }{ \|x_i\| \cdot \|x_j\| }, $$
其中 $\|x_i\| = \sqrt{\sum_{k=1}^p x_{ik}^2}$ 為向量 $x_i$ 的 L2 範數(Euclidean norm)。
餘弦距離用於度量向量間的夾角大小,常用於文本分析與高維稀疏資料。
透過距離公式的計算,我們可以得到距離矩陣 $\mathbf{D}$
$$ \mathbf{D} = \begin{pmatrix} d_{11} & d_{12} & \cdots & d_{1n} \\ d_{21} & d_{22} & \cdots & d_{2n} \\ \vdots & \vdots & \ddots & \vdots \\ d_{n1} & d_{n2} & \cdots & d_{nn} \end{pmatrix}, $$
其中 $\mathbf{D} \in \mathbb{R}^{n \times n}$ , $d_{ij}$ 表示樣本 $x_i$ 與 $x_j$ 之間的距離,$\mathbf{D}$ 為對稱矩陣,且對角線元素 $d_{ii} = 0$。
雙重中心化
接下來,為了求得樣本間的內積結構,我們需要將距離矩陣平方,從而獲得平方距離矩陣(squared proximity matrix) $\mathbf{D}^{(2)}$ 。
$$ \mathbf{D}^{(2)} = \begin{pmatrix} d_{11}^2 & d_{12}^2 & \cdots & d_{1n}^2 \\ d_{21}^2 & d_{22}^2 & \cdots & d_{2n}^2 \\ \vdots & \vdots & \ddots & \vdots \\ d_{n1}^2 & d_{n2}^2 & \cdots & d_{nn}^2 \end{pmatrix}. $$
MDS 假設所有樣本來自一個中心化的空間,我們可以經由以下式子將平方距離矩陣還原為內積矩陣 $\mathbf{B}$ 。
$$ \mathbf{B} = - \frac{1}{2} \mathbf{C} \mathbf{D}^{(2)} \mathbf{C}, $$
其中, $\mathbf{C} = \mathbf{I} - \frac{1}{n} \mathbf{J}_n$ 是中心矩陣(centering matrix), $\mathbf{I}$ 是 $n \times n$ 單位矩陣, $\mathbf{J}$ 是 $n \times n$ 全一矩陣(all-ones matrix),
$$ \mathbf{I} = \begin{pmatrix} 1 & 0 & \cdots & 0 \\ 0 & 1 & \cdots & 0 \\ \vdots & \vdots & \ddots & \vdots \\ 0 & 0 & \cdots & 1 \end{pmatrix}, \qquad \mathbf{J} = \begin{pmatrix} 1 & 1 & \cdots & 1 \\ 1 & 1 & \cdots & 1 \\ \vdots & \vdots & \ddots & \vdots \\ 1 & 1 & \cdots & 1 \end{pmatrix}. $$
上述操作稱為雙重中心化,用於將資料集的行、列平均值扣除,將資料集的原點移至中心。其中, $\mathbf{B}$ 的元素 $b_{ij}$ 可解釋為樣本 $x_i$ 和 $x_j$ 的內積。
$$ b_{ij} = x_i^\top x_j. $$
特徵值分解
再來,要對內積矩陣 $\mathbf{B}$ 進行特徵值分解(eigen decomposition),可以得到
$$ \mathbf{B} = \mathbf{V} \mathbf{\Lambda} \mathbf{V}^\top, $$
其中,$\mathbf{\Lambda} = \mathrm{diag}(\lambda_1, \lambda_2, \cdots, \lambda_n)$ 是 $\mathbf{B}$ 的特徵值矩陣,且 $\lambda_1 \geq \lambda_2 \geq \cdots \geq \lambda_n$ 。而 $\mathbf{V} = (v_1, v_2, \cdots, v_n)$ 為對應的正交特徵向量矩陣。
降維與新座標
現在,我們可以決定要透過 MDS 降到的維度 $r$ 了。我們只取前 $r$ 個最大、正的特徵值及其對應特徵向量,用以進行降維。而降維後新的維度資料 $\mathbf{X}_r$ 則表示為
$$ \mathbf{X}_r = \mathbf{V}_r \mathbf{\Lambda}_r^{1/2}, $$
其中, $\mathbf{X}_r$ 表示降維後的結果,每一列為一個樣本在 $r$ 維空間的座標。 $\mathbf{V}_r$ 是前 $r$ 個特徵向量組成的 $n \times r$ 矩陣。 $\mathbf{\Lambda}_r$ 是前 $r$ 個特徵值組成的 $r \times r$ 對角矩陣。
至此,就做完 MDS 的降維了。如果選擇降維到 2 維或 3 維環境,則可以繪製成平面或立體的資料散佈圖,幫助我們以視覺化的方式觀察資料群集或結構。資料集若附有類別標籤,則可依不同類別繪製不同顏色,以便更好辨識不同群組或類型的樣本。
MDS 的輸出只保留相對距離,因此結果可任意旋轉、平移、鏡射,不影響其解釋。我們也能將 MDS 的散佈圖與真實世界座標對齊,用於解釋樣本在真實世界中的位置關係或分布結構。
結論
MDS 提供一種直觀的方式,將高維資料中的樣本關係轉換到低維空間,同時保留樣本間的相對距離結構。 MDS 很適合用於將高維度資料以視覺化方式呈現,讓我們能夠更直觀的觀察、解釋、分析各樣本。是資料分析與視覺化的好選擇。
參考資料
Multidimensional scaling。(2025年4月17日)。維基百科,自由的百科全書。2025年5月15日參考自 https://en.wikipedia.org/wiki/Multidimensional_scaling
一矩陣。(2022年10月18日)。維基百科,自由的百科全書。2025年5月15日參考自 https://zh.wikipedia.org/zh-tw/一矩陣
Centering matrix。(2025年4月14日)。維基百科,自由的百科全書。2025年5月15日參考自 https://en.wikipedia.org/wiki/Centering_matrix


